We are running a ceramic node connected to the Clay testnet and our own IPFS cluster inside of Kubernetes (k8s), and it is periodically dying and becoming unresponsive. It is restarting very often (13 times so far today), but when it goes completely non responsive the pattern looks like this in the logs:
node:1) MaxListenersExceededWarning: Possible EventTarget memory leak detected. 11 abort listeners added to [AbortSignal]. Use events.setMaxListeners() to increase limit
(Use node --trace-warnings ... to show where the warning was created)
(node:1) MaxListenersExceededWarning: Possible EventTarget memory leak detected. 11 abort listeners added to [AbortSignal]. Use events.setMaxListeners() to increase limit
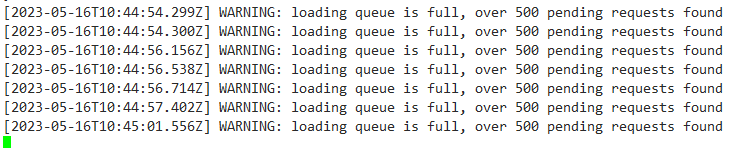
WARNING: execution queue is full, over 500 pending requests found
(Repeat every 0.1 sec or less)
WARNING: Error loading stream kjzl6cwe1jw145s38h43vemjf49yl2soe4vgm2vc8v6rch3booyykul3wj3tvod at time undefined as part of a multiQuery request: Error: Timeout after 7000ms
(Repeat every 0.1 sec or less)
Our k8s healthcheck is not rebooting when it gets into this state, but our attached clients just get errors of the form “Cannot get stream”. Manually rebooting the node seems to restore it, but I did that this morning and had to do it again just now. I have not found anything in the logs that indicates errors prior to this pattern, but the logs are, how should I say, “voluminous”.
Is there anything I can look for or check? The only other logs I am getting are the startup logs, ending with: IMPORTANT: Ceramic API running on 0.0.0.0:7007
After restart just now, it did not error with MaxListenersExceededWarning, it just went directly to Error loading stream kjzl6cwe1jw145s38h43vemjf49yl2soe4vgm2vc8v6rch3booyykul3wj3tvod errors.
ERROR: Cannot publish query message to pubsub because we have exceeded the maximum allowed rate. Cannot have more than 100 queued queries.
Our node is currently in a k8s crash-backoff loop and I can’t get it back to operation. We’re unfortunately having to table Ceramic as our storage layer for the time being.
open source, P2P data is hard - will do our best to improve. let me know if i can DM you in in the future when it has the stability guarantees you need.
consistent error messages like this for some duration would likely result in read/write requests timing out on the client side, maybe you have seen this as well
Best guess is you have a load spike, and the default number of inmemory streams allowed is not high enough for your load. You could increase the limit by setting node.stream-cache-limit parameter in your Ceramic daemon config. You could vary the number based on memory available on your machine. Start making it higher until you see that the memory is utilised.
For some more context, Ceramic has 2 main queues that are used internally. The loading queue serializes all stream loads to the same streamid, and allows up to 500 different streams to be loading at a time. The execution queue works similarly but processes write operations. The error message you are seeing is indicating that you have more than 500 different streams being loaded all at once. Once the loading queue is full, all future reads and writes will time out until the queue opens up again (writes are also affected because a stream needs to be loaded first before it is written to, so write operations first load the stream via the loading queue then update it via the execution queue).
If a lot of your traffic involves loading or updating existing streams that your node has operated on before, then increasing the size of the stream cache as @ukstv recommended would indeed help a lot by eliminating the need to load streams from the state store because they are already in memory. If, however, most of your traffic is creating new streams or loading streams from the network that your node doesn’t already have pinned, then increasing the size of the cache likely won’t help much since the stream wont be in memory anyway.
Can you share a bit more about your use case and usage patterns? How many reads and writes are you doing per minute? What are the nature of those reads and writes (ie creating new streams, updating streams that were created on your node, loading or updating streams that were created on someone else’s node, etc)? Also what do the streams themselves look like - do you tend to have lots of little streams that don’t get updated after being created, or do you have streams that get updated many times and have very long log histories?
It would also be a good idea to check out the health of your IPFS node (esp CPU and memory utilization). If your IPFS node is overwhelmed, that can make it take a long time to load data from IPFS, which in turn would make it take a long time for Ceramic streams to load. The longer each stream takes to load, the longer the stream stays in the loading queue, increasing the likelihood of the queue getting full.
We are seeing quite a bit of CID load that ultimately failed. [2023-05-17T09:17:42.219Z] ERROR: Error while loading commit CID bagcqceraaeproqlbcggwdwsq4xlcwvzdsmnrhccnxot7pmch2xsm5eviw5jq from IPFS for stream k2t6wyfsu4pfzvdxw5j1x4kmgnasy2eoiertgsklgqffiub71q5f73vea4l2nh: TimeoutError: context deadline exceeded
Some of the load IPFS with CIDs request failed after 3 attempts. When would this happen? Does this mean the commits got GCed?
Do you know the tps write volume coming in on those indexed models?
This can definitely explain why your loading queue is full - loadStream requests are taking up slots in the queue while waiting on IPFS to time out.
As for why it happens - it would happen if the CID was GCd or otherwise not available on the network, but ipfs garbage collection is disabled by default so unless you explicitly enabled it that’s unlikely to be the cause. More likely is that your IPFS node is in a degraded state. This is why I asked about the CPU and memory utilization on your node, which I still recommend checking. We have seen that when IPFS gets overwhelmed it degrades very non-gracefully and can get stuck in a state like this where many or even all requests to it wind up timing out. Sometimes even if load goes back down it doesn’t fully recover, so restarting the IPFS node can sometimes improve things. Of course if the load is ongoing then restarting won’t help as the node will just get overwhelmed again.
This we are not sure yet. How do we instrument so that we could find out? We were assuming we could learn about this via our indexer ( no more than 10 request per second). But for indexed models configured within Ceramic, we haven’t found a precise measurement yet without hacking ceramic code
hmm yeah there’s no simple metric exposed for this currently. I guess a crude manual way to do this would be to directly connect to the indexing database (postgres or sqlite) and run a count query on the tables for the different models periodically and see how much the count grows over time
We did try to load the failed CIDs requests using public gateway like https://cloudflare-ipfs.com/ipfs/ and still not able to load thems. A small sample of such CIDs could be found here Discord