Grant/Project Name:
Web3 Analytics
Proposer’s contact info:
Andy Jagoe (Contact Me)
Grant Category:
Tooling/Analytics
ELI5 Project Summary:
A decentralized and composable analytics platform for web3. Like Dune Analytics for off-chain data. Or a web3 version of Google Analytics.
Project Description:
Today, web3 projects have no good way to transparently collect and share usage and traction analytics with stakeholders when it happens off-chain. On-chain analytics are great, but they’re the very bottom of the funnel. A tiny fraction of the user journey. They miss everything that leads up to a transaction, and everything that happens afterwards. Alone, they are just not enough.
80% of the top 10,000 web sites on the internet use Google Analytics. In fact, the majority of web3 projects do too. But, as a web3 project, giving all your data to Google breaks your brand promise to users, goes against the ethos of decentralization, and misses the benefits of transparency and composability. Big Tech sells this data to the highest bidder for ad targeting. And users have no control over their data and no visibility into what is collected.
But a web3 project without analytics is flying blind. Without analytics, you have no data driven product insights. Only guesses. Trying to build a consumer product without analytics is like trying to fly a 747 jet airplane without instruments or a dashboard. It’s very difficult, and often ends in a bad outcome. A competitor who has analytics will fly circles around you if you don’t.
The goal of this project is to do for off-chain data what Ethereum + Dune Analytics has done for on-chain data.
How is this different?
All the analytics solutions today are centralized and default closed. This means that only the app owner can see the dashboards and what data is being collected. Users do not own their data and may not delete it unless the app owner allows them to. Also, because data is centralized, these solutions can be censored or shut down. And most importantly, data in today’s closed systems is not composable or verifiable, inhibiting innovation and creativity.
By contrast, the solution I’m proposing is a decentralized and composable public good, where all data is readable by anyone and censoring it or shutting it down is difficult. Projects can get critical product insights to improve user experience without breaking a user’s trust or compromising web3 values. Composability encourages innovation and enables permissionless analysis not possible today. And it is default open, so it increases transparency around project usage and traction. It does for off-chain data what Dune Analytics has done for on-chain data.
Current Status:
I have received a small grant from Filecoin Foundation toward this project and have already built a proof-of-concept (alpha) using Ceramic DIDDatastore, TileLoader and a custom Secp256k1 key did resolver. The system consists of 5 components:
- Front-End Instrumentation Tooling
- Decentralized Data Network (Ceramic)
- Smart Contract Registry
- Indexer
- Dashboard Builder / UI
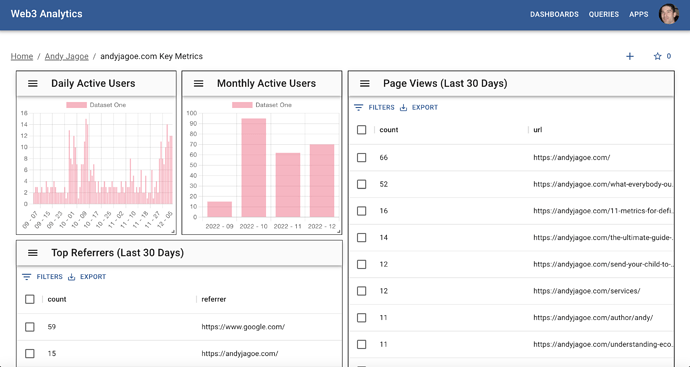
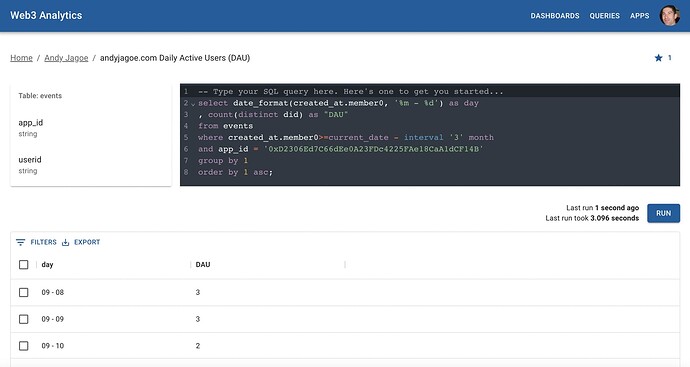
Here is how the system works, with links to source code and the prototype.
Sample dashboard (live URL):
Sample query (live URL):
Purpose of this grant:
The purpose of this grant is to help me finish migrating the system to ComposeDB and to deliver the below features needed for usability and parity with web2 alternatives:
- Indexer improvements for production scalability
- User forking of queries and dashboards (like Dune Analytics)
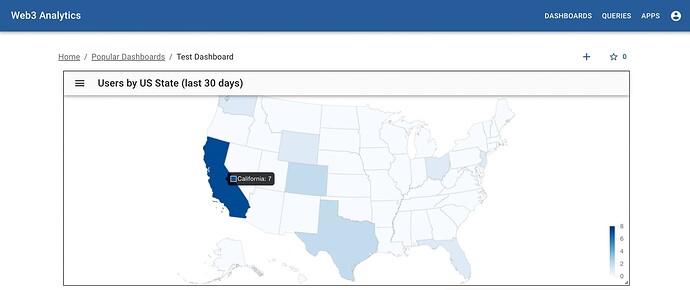
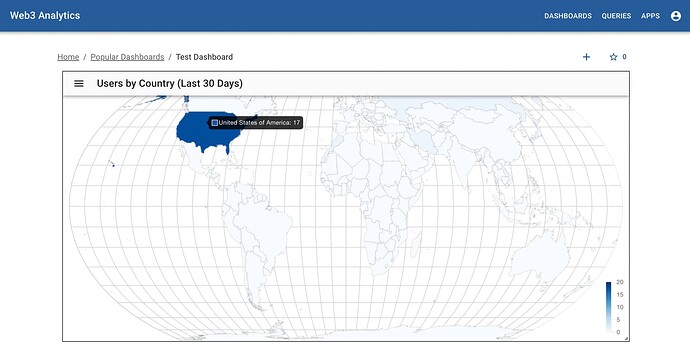
- Adding geo tracking, geo queries, and map dashboard components
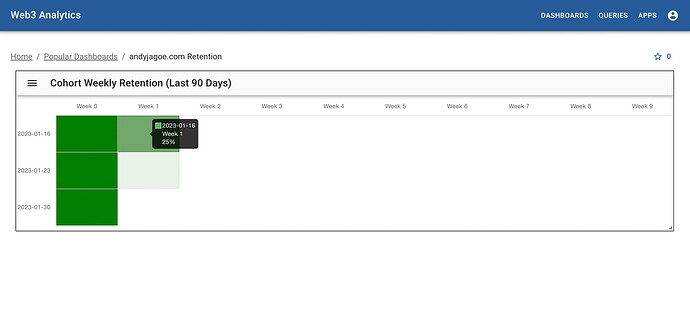
- Adding engagement/time spent tracking and retention / cohort analysis queries and dashboard components
- Automatic updating of queries and dashboards
- Low balance smart contract monitoring and email notification
Relevant links:
-
Website (personal): https://andyjagoe.com/
-
Website (project): https://web3analytics.network/
-
Farcaster: @andyjagoe
-
Github: andyjagoe
-
Previous projects the team has meaningfully contributed to:
-
Recent
- Working Web3 Analytics alpha (components and source code)
- Alertcaster: Monitors Farcaster for interesting new content (Like Google Alerts but for Farcaster) - Docs - User Reviews
- Web3 consulting for AngelList
-
Previous: (https://andyjagoe.com/about/)
- Turned around search company and sold to eBay as VP Product and Engineering
- Founded messaging company and grew to millions of users (sold to Skype)
-
-
Comparable projects or peers: Dune Analytics
Ceramic Ecosystem Value Proposition:
What is the problem statement this proposal hopes to solve for the Ceramic ecosystem?
- From the ceramic ecosystem perspective: how do you collect data and share product insights with all project stakeholders in a way that preserves user privacy and encourages permissionless innovation?
- From the 3Box perspective: how do you accelerate developer adoption of Ceramic?
How does your proposal offer a value proposition solving the above problem?
- Every application needs analytics, and open and composable analytics is better than closed and proprietary analytics. Web3 is a good niche to start with, but ultimately this project could make every developer a Ceramic customer.
Why will this solution be a source of growth for the Ceramic ecosystem?
- Each application that instruments with Web3 Analytics generates a continuous river of data into Ceramic. More data means more potential fee income for the Ceramic ecosystem. More fee income enables growth and reinvestment by all participants into the Ceramic ecosystem.
- The risk of not having an application like this on Ceramic is that someone creates a similar application for a competing ecosystem and that ecosystem is the beneficiary of the increased usage and fee income instead.
Funding requested (DAI/USDC):
$39,200
Milestones:
-
Milestone #1 (4 weeks):
- Migrate to Composites
- Create new composite for analytics data
- Include location and time data in composite (not in current model)
- Test and publish new composite
- New data indexer features
- Batch load event objects instead of loading individually with TileDocument.load()
- Complete general migration to ComposeDB
- New instrumentation features
- Build location database service using maxmind
- Integrate location data option in tracking package
- New sample SQL queries
- Geo/location analysis
- Retention / cohort analysis
- New dashboard components
- Map widget using chartjs-chart-geo
- Cohort analysis widget using chartjs-chart-matrix
- Integration testing and dev ops
- Migrate to Composites
Future Roadmap:
- Authenticity verification for tracking (i.e. how to prevent bad data / spam)
- Modify the tracking library to sign the page and inputs and send the signature with each tracking payload.
- App owner signs and stores canonical “true” copy of the page/site in Ceramic and a new version is added with each deploy using a Github workflow
- Indexers can look up the signed and verified page at the time the payload was written and verify it is real user data.
- Once ComposeDB is more mature and scalable, use GraphQL to go directly to ComposeDB for queries/dashboard instead of the intermediate step of using an indexer to load Ceramic data into an S3 Data Lake and using SQL via AWS Athena.
I accept the 3Box Labs Grants terms and conditions: Yes
I understand that I will be required to provide additional KYC information to the 3Box Labs to receive this grant: Yes
